Example Use Cases
Breast Cancer
The prepared breast cancer use case tests selected feature selection approaches (both prior knowledge and traditional) to retrieve genes that best separate the samples into their PAM50 breast cancer subtypes (basal, normal-like, luminal A, luminal B, HER2). The repository contains two breast cancer data sets that are ready for execution with Comprior (links to R-based preprocessing scripts will be added later and are also available upon request):
TCGA.zip: normalized BRCA samples (no normals) from TCGA including metadata. Contains 1090 samples for 20950 genes. This data must be downloaded by following the instructions in TCGA_README.txt.
SCANB_labeled.csv.zip: labeled data set for cross-validation. Contains 378 SCANB samples for 15011 genes from the training cohort (GSE81538)
unzip the files:
cd data/input/TCGA-SCANB
unzip SCANB_labeled.csv.zip
unzip TCGA.zip
- make sure the file paths in Comprior/code/configs/TCGA_SCANBconfig.ini are still correct
- check input and metadata parameters in Dataset section and crossEvaluationData parameter in Evaluation section)
- the resolved inputDir parameter is provided in the main config.ini file and should point to your local Comprior folder
- adapt further configuration parameter as you like, e.g. add “Random” to traditional_methods
Execution via Source Installation
make sure you installed Comprior (see Install and Run Comprior from Source) beforehand and homePath, RscriptLocation, and JavaLocation parameters are correctly set in the main config.ini file
navigate to code/Python/comprior (assuming you are still located at Comprior/data/input/TCGA-SCANB):
cd ../../../code/Python/comprior
start Comprior and provide the config file for this use case:
python3 pipeline.py --config ../../configs/TCGA_SCANBconfig.ini
Check your results in data/results/TCGA-SCANB_UseCase - see Folder Structure - Where to find what Files (In- and Output) for an explanation on the folder structure.
Execution via Docker Image
make sure you have built the docker container as described in Run Comprior in a Docker Container
copy the folder containing the input files (BRCA_TP_expressions_normalized.csv, BRCA_TP_metadata.csv, and SCANB_labeled.csv) to Comprior/comprior_docker/input (assuming you are in Comprior’s main directory):
cp -r data/input/TCGA-SCANB comprior_docker/input
copy the config file TCGA_SCANBconfig.ini to Comprior/comprior_docker:
cp code/configs/TCGA_SCANBconfig.ini comprior_docker
make sure the input, metadata, and crossEvaluationData parameters point to the right location. If your data is located within a subfolder of the Comprior/comprior_docker/input directory, add this to the parameter. Do not provide absolute paths and keep the ${General:inputDir}, as it is internally resolved to point towards the input directory:
[Dataset]
input = ${General:inputDir}TCGA-SCANB/BRCA_TP_expressions_normalized.csv
metadata = ${General:inputDir}TCGA-SCANB/BRCA_TP_metadata.csv

[Evaluation]
crossEvaluationData = ${General:inputDir}TCGA-SCANB/SCANB_labeled.csv
run the Docker container as root and provide the absolute path to Comprior/comprior_docker as mount directory (only change /your/absolute/path/to/ AND retype the double hyphen for –config; for some reason the config parameter will not be recognized if the statement is just copied from here):
sudo docker run -it --rm -v /your/absolute/path/to/Comprior/comprior_docker:/home/app/data comprior --config /home/app/data/TCGA_SCANBconfig.ini
Check your results in Comprior/comprior_docker/results/TCGA-SCANB_UseCase - see Folder Structure - Where to find what Files (In- and Output) for an explanation on the folder structure and Output Generated by Comprior for a more detailed description on the generated plots.
Glioma
The prepared glioma use case tests selected feature selection approaches (both prior knowledge and traditional) to retrieve genes that best separate the samples into their glioma subtypes astrocytoma, glioblastoma, and oligodendroglioma. The repository contains two glioma data sets that are ready for execution with Comprior(links to R-based preprocessing scripts will be added later and are also available upon request):
TCGA.zip: normalized GBM and LGG samples (no normals) from TCGA including metadata. Contains 496 samples for 19301 genes.
REMBRANDT_labeled.csv.zip: labeled data set for cross-validation. Contains 436 samples for 31442 probes from the REMBRANDT study (microarray data, GSE108474)
unzip the files:
cd data/input/GBM-LGG
unzip REMBRANDT_labeled.csv.zip
unzip TCGA.zip
- make sure the file paths in Comprior/code/configs/GBMLGGconfig.ini are still correct
- check input and metadata parameters in Dataset section and crossEvaluationData parameter in Evaluation section)
- the resolved inputDir parameter is provided in the main config.ini file and should point to your local Comprior folder
- adapt further configuration parameter as you like, e.g. add “Random” to traditional_methods
Execution via Source Installation
make sure you installed Comprior (see Install and Run Comprior from Source) beforehand and homePath, RscriptLocation, and JavaLocation parameters are correctly set in the main config.ini file
navigate to Comprior/code/Python/comprior*(assuming you are still located at *Comprior/data/input/GBM-LGG):
cd ../../../code/Python/comprior
start Comprior and provide the config file for this use case:
python3 pipeline.py --config ../../configs/GBMLGGconfig.ini
Check your results in data/results/GBMLGG_UseCase - see Folder Structure - Where to find what Files (In- and Output) for an explanation on the folder structure.
Execution via Docker Image
make sure you have built the docker container as described in Run Comprior in a Docker Container
copy the folder containing the input files (GBM-LGG_TP_expressions_normalized.csv, GBM-LGG_TP_metadata.csv, and REMBRANDT_labeled.csv) to Comprior/comprior_docker/input (assuming you are in Comprior’s main directory):
cp -r data/input/GBM-LGG comprior_docker/input
copy the config file GBMLGGconfig.ini to Comprior/comprior_docker:
cp code/configs/GBMLGGconfig.ini comprior_docker
make sure the input, metadata, and crossEvaluationData parameters point to the right location. If your data is located within a subfolder of the Comprior/comprior_docker/input directory, add this to the parameter. Do not provide absolute paths and keep the ${General:inputDir}, as it is internally resolved to point towards the input directory:
[Dataset]
input = ${General:inputDir}GBM-LGG/GBM-LGG_TP_expressions_normalized.csv
metadata = ${General:inputDir}GBM-LGG/GBM-LGG_TP_metadata.csv

[Evaluation]
crossEvaluationData = ${General:inputDir}GBM-LGG/SCANB_labeled.csv
run the Docker container as root and provide the absolute path to Comprior/comprior_docker as mount directory (only change /your/absolute/path/to/ AND retype the double hyphen for –config; for some reason the config parameter will not be recognized if the statement is just copied from here):
sudo docker run -it --rm -v /your/absolute/path/to/Comprior/comprior_docker:/home/app/data comprior --config /home/app/data/GBMLGGconfig.ini
Check your results in Comprior/comprior_docker/results/GBMLGG_UseCase - see Folder Structure - Where to find what Files (In- and Output) for an explanation on the folder structure and Output Generated by Comprior for more a more detailed explanation on the generated plots.
Output Generated by Comprior
Detailed Processing Outputs
- Comprior.log contains more detailed outputs compared to the command line output. If you find that there is a figure or other output missing that you expected to be there, look at the log file as it is likely that a corresponding warning was posted there (e.g. Comprior does not automatically stop when a knowledge base does not return any results but just continues with the empty set of prior knowledge).
Plots on Datasets
If preanalysis_plots (Evaluation section) was provided with one or more keywords in your config file, Comprior creates corresponding plots for the input data sets (both the main and - if available - the labeled one for cross-validation). Colors for class labels are the same across all plots created. You can find the plots in Comprior/data/results/YourExperimentName/preanalysis
MDS plot
- keyword: mds
- multidimensional scaling plot showing dis-/similarities between samples
- output file name: mds_InputDatasetName.pdf
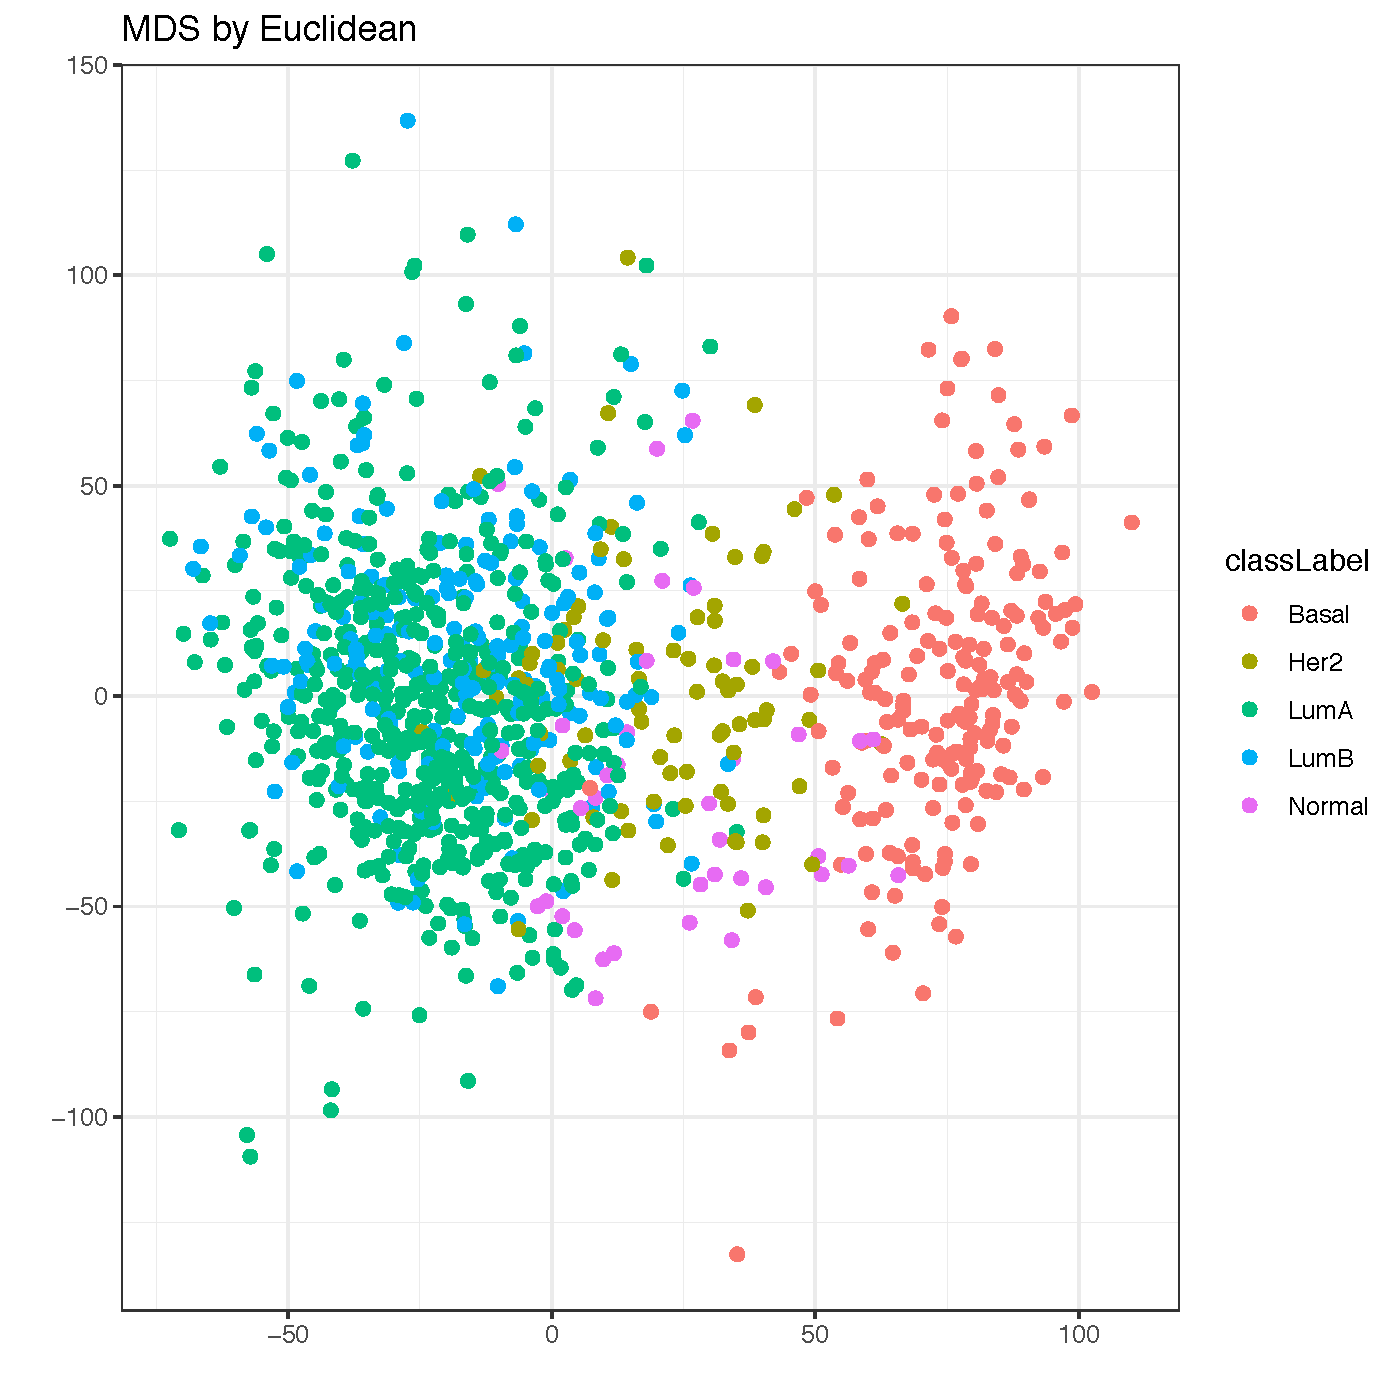
Multidimensional scaling (MDS) plot for the input data set (TCGA) of the BRCA use case, one line per class label.
Density Plot
- keyword: density
- shows the average density distribution of expression levels per class label
- output file name: density_InputDatasetName.pdf
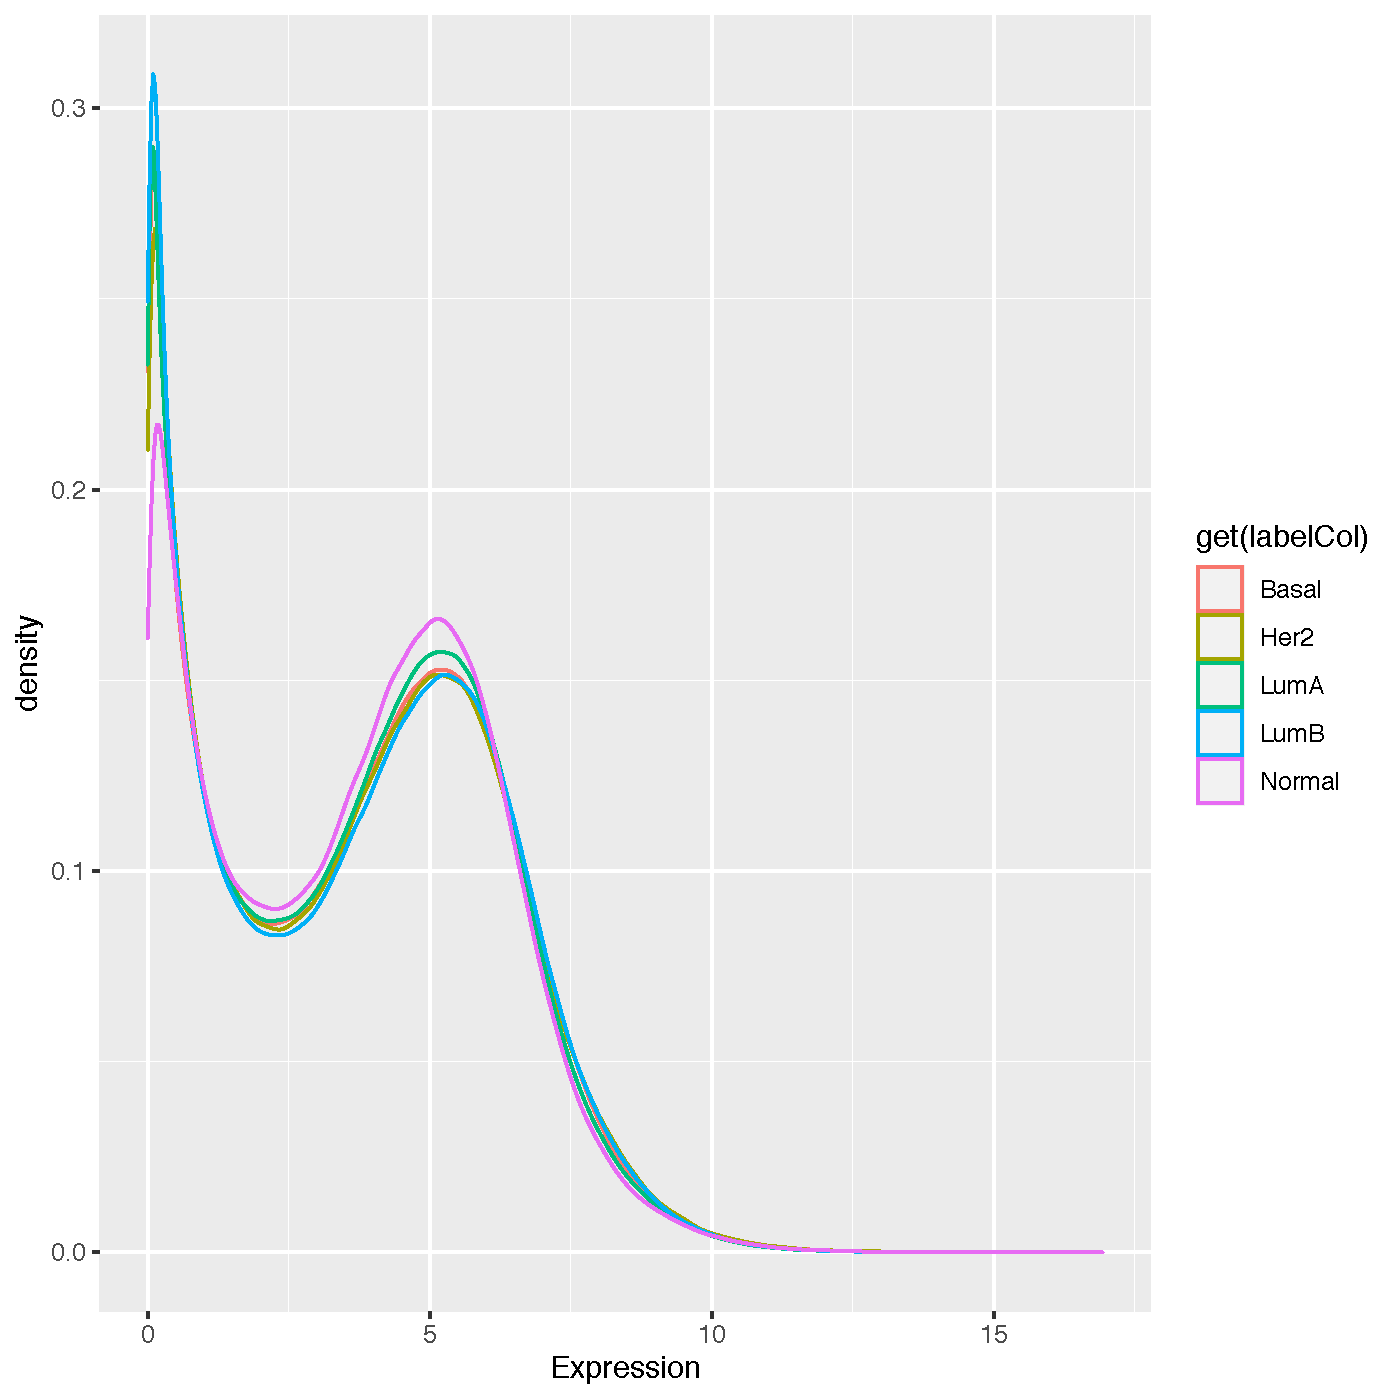
Density plot for the input data set (TCGA) of the BRCA use case, one line per class label.
Box Plot
- keyword: box
- shows the expression levels with one box per class label
- output file name: distribution_InputDatasetName.pdf
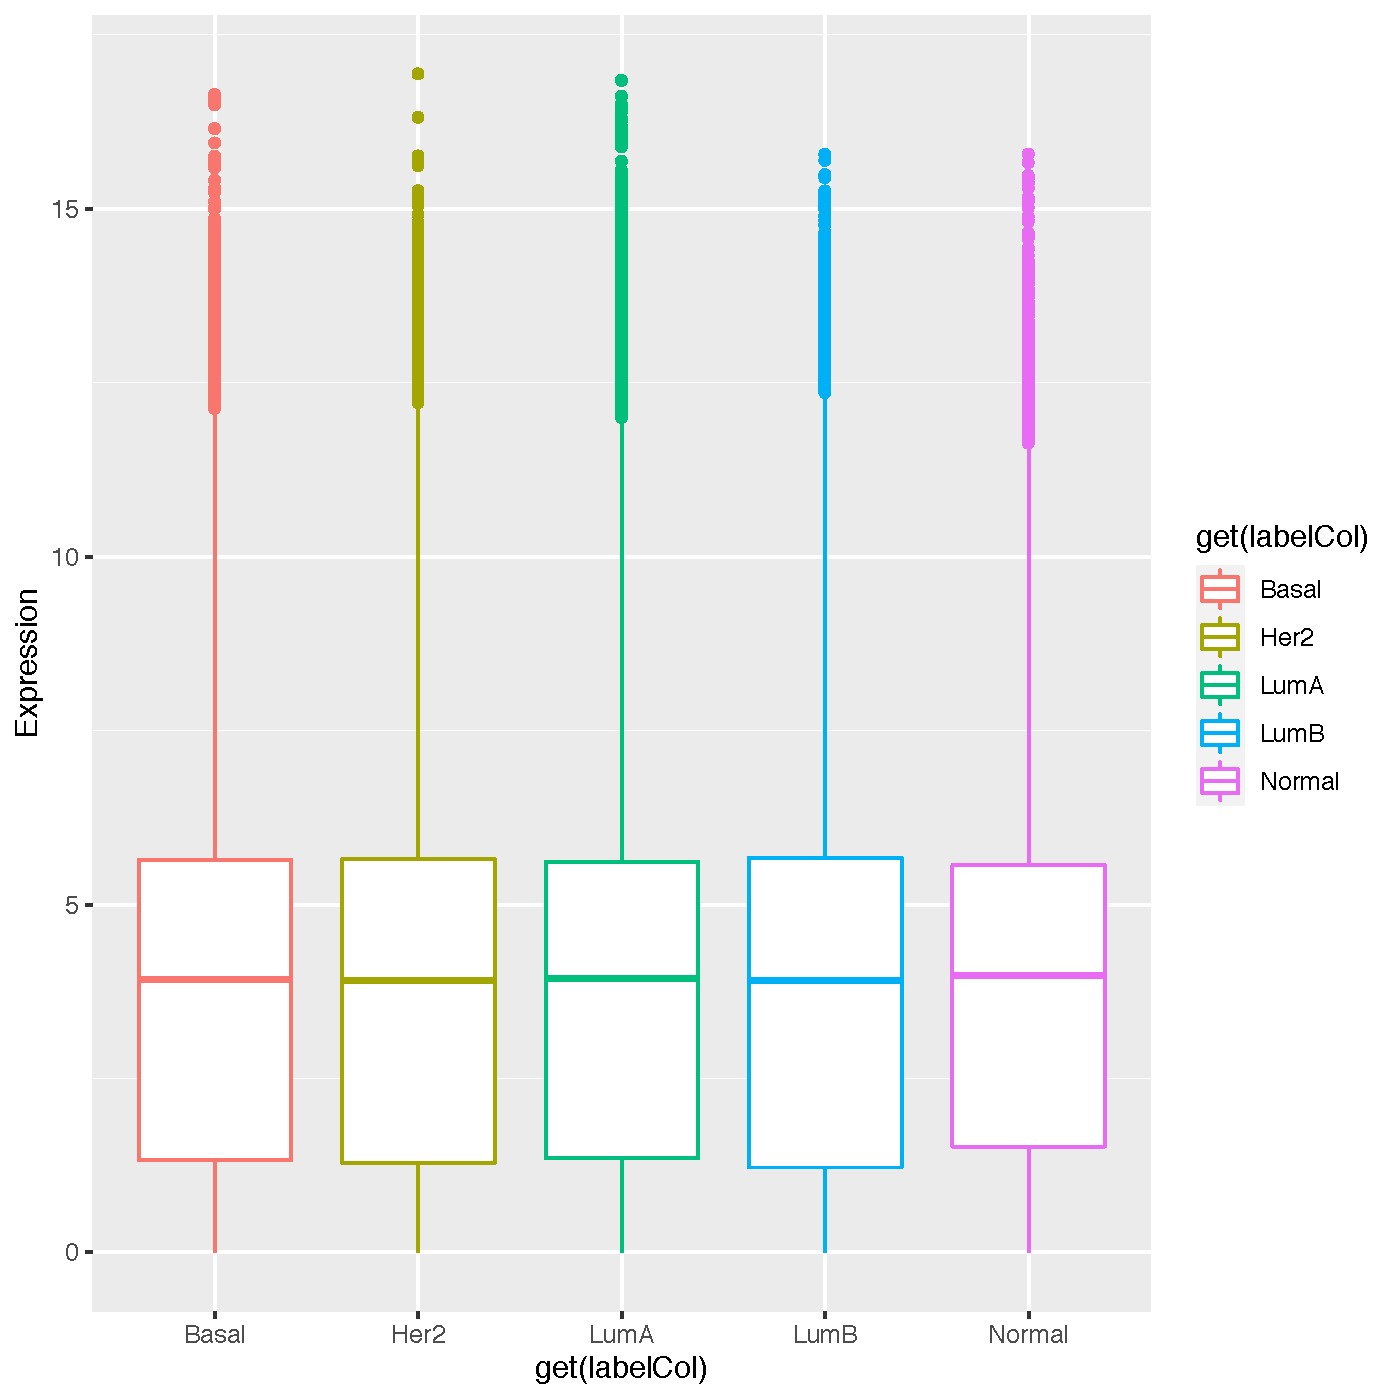
Box plot for the input data set (TCGA) of the BRCA use case, one box per class label.
Knowledge Base Coverage
If evaluateKBcoverage (Evaluation section) is set to true in your config file, Comprior examines how much the search terms provided in the config file are covered by the knowledge bases that are used in this experiment. For example, if you use Postfilter_Variance_DisGeNET, then Comprior will check the coverage of DisGeNET only. You can find the plots in Comprior/data/results/YourExperimentName/preanalysis.
If a search term has more than 15 signs, Comprior will map the search terms to a shorter ID and use this instead for the plots. The mapping from search term to ID is then provided in Comprior/data/results/YourExperimentName/preanalysis/searchterm_IDs.txt.
Gene Coverage Plots
- created for every knowledge base (see Gene Association Score Computation from Network Information for how an individual gene association score is computed for interaction knowledge bases that only retrieve network information)
- file name: KnowledgeBaseName_GeneCoverage.pdf (source file: KnowledgeBaseName_GeneStats.csv)
- box plot shows the distribution of association scores (left-hand y axis) that are returned for a given search term, the underlying bar plot shows how many genes (right-hand y axis) were returned per search term (attention: gene sets are not disjunct, i.e. results for search terms can show a high overlap if the search terms are similar)
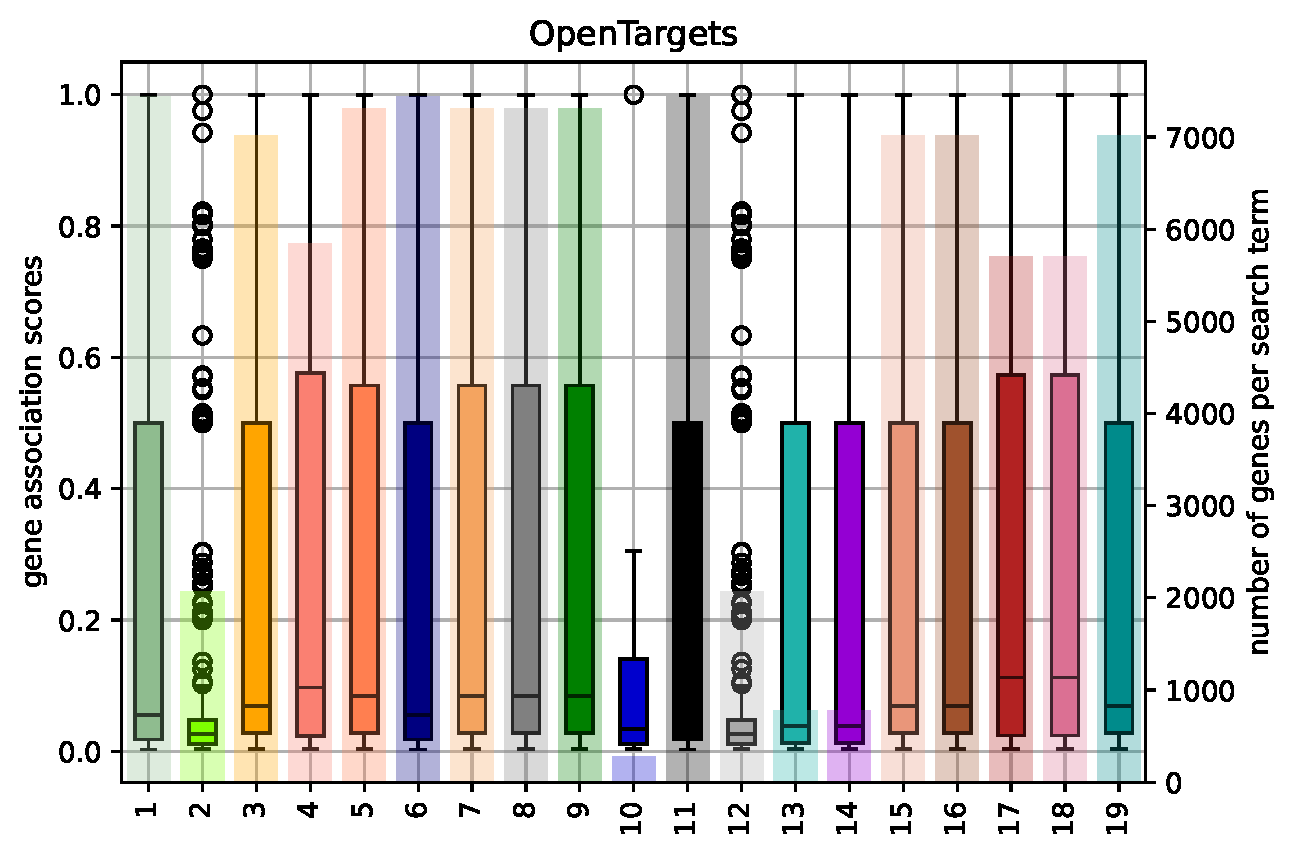
Prior knowledge coverage in OpenTargets for the search terms used in the GBM-LGG use case. Boxes show the association scores returned for the genes related to the search term, bars showing the overall number of genes returned for a search term.
Pathway Coverage Plots
- created only for knowledge bases providing network information, e.g. KEGG or PathwayCommons
- file name: KnowledgeBaseName_PathwayCoverage.pdf (source file: KnowledgeBaseName_PathwayStats.csv)
- box plot shows the distribution of network sizes (i.e., number of member genes, left-hand y axis) that are returned for a given search term, the underlying bar plot shows how many networks (right-hand y axis) were returned per search term (attention: pathway sets are not disjunct, i.e. results for search terms can show a high overlap if the search terms are similar)
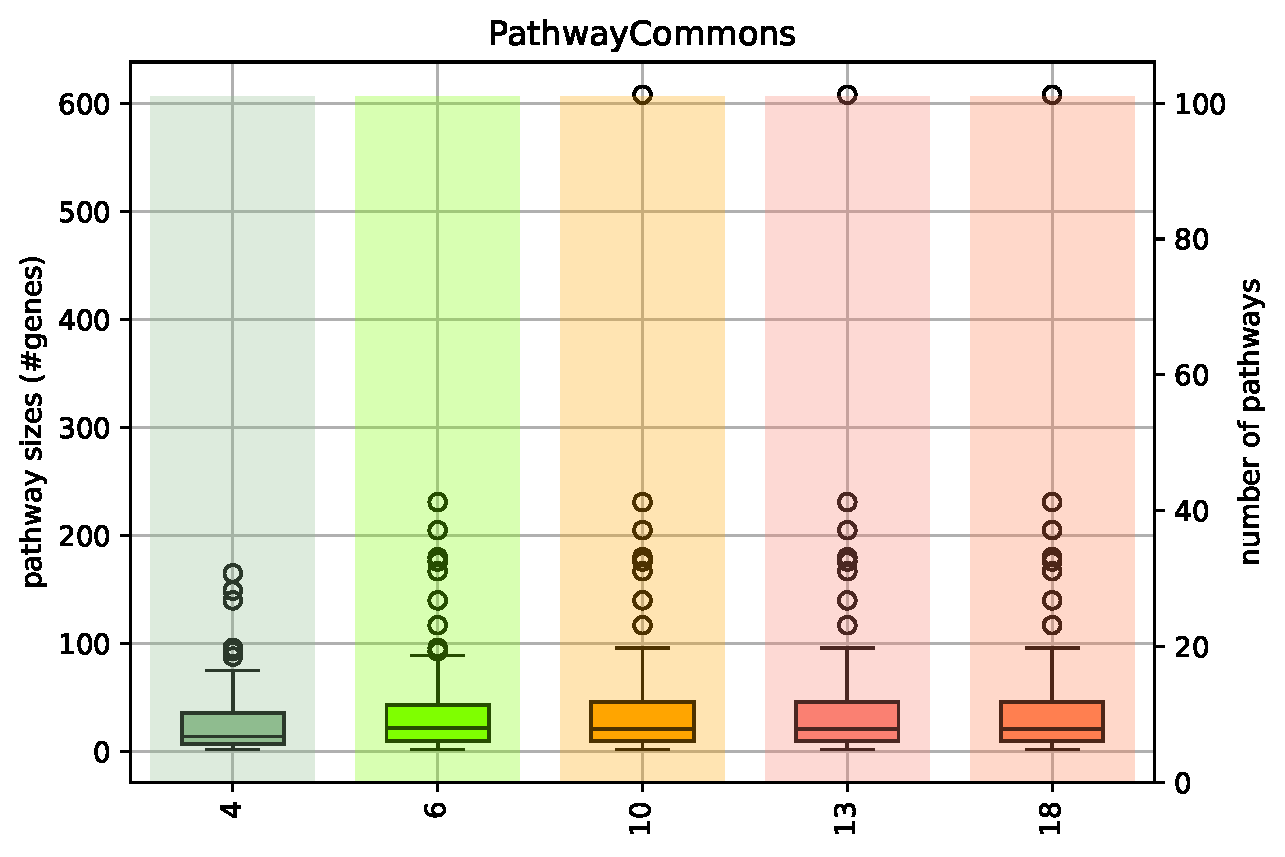
Prior knowledge coverage in PathwayCommons for the search terms used in the GBM-LGG use case. Boxes show the pathway sizes (=number of genes) of the retrieved pathways, bars showing the overall number of pathways returned for a search term.
Feature Rankings
Every feature selection approach creates a corresponding feature ranking of all the input features. The corresponding rankings (ApproachName.csv) are located at Comprior/data/results/YourExperimentName/GeneRankings/ and contains an ordered feature list, thus the top k features in the list will be used for classification later on. Based on what keywords are provided for the metrics (Rankings section) parameter in your config file, Comprior creates corresponding plots in Comprior/data/results/YourExperimentName/evaluation/rankings and uses a consistent color scheme.
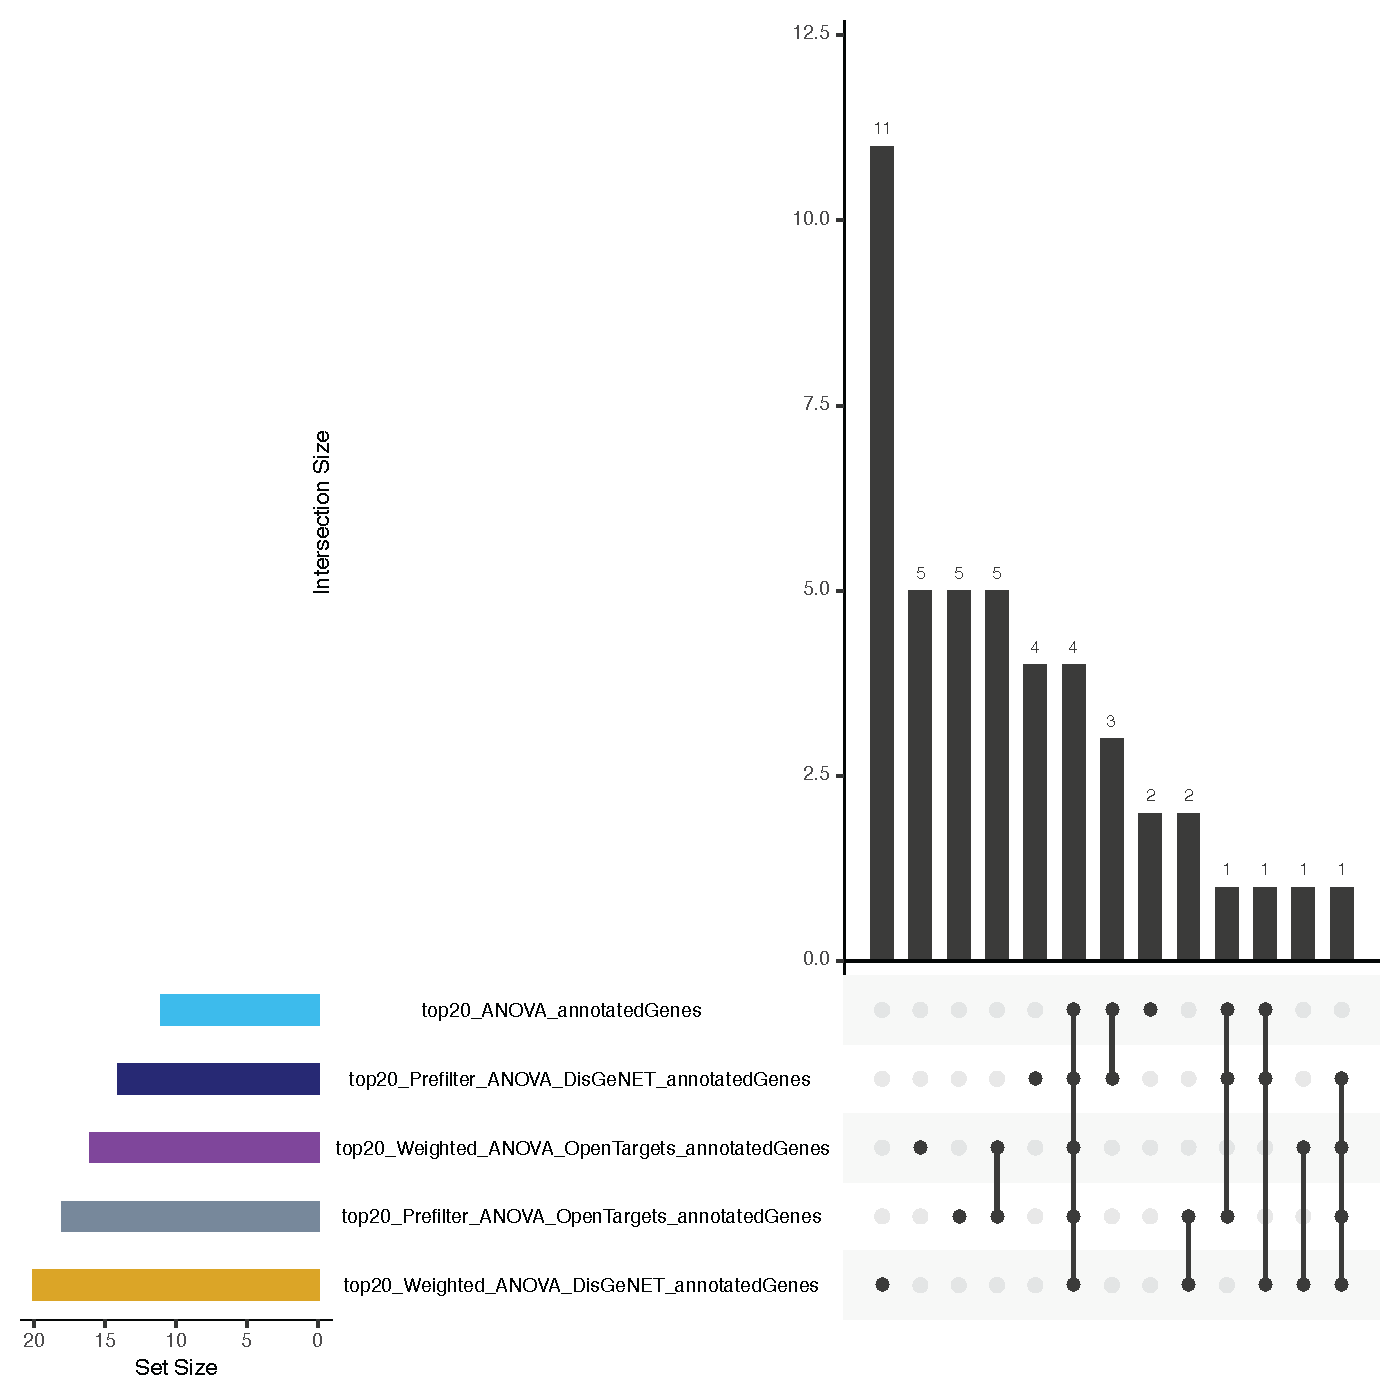
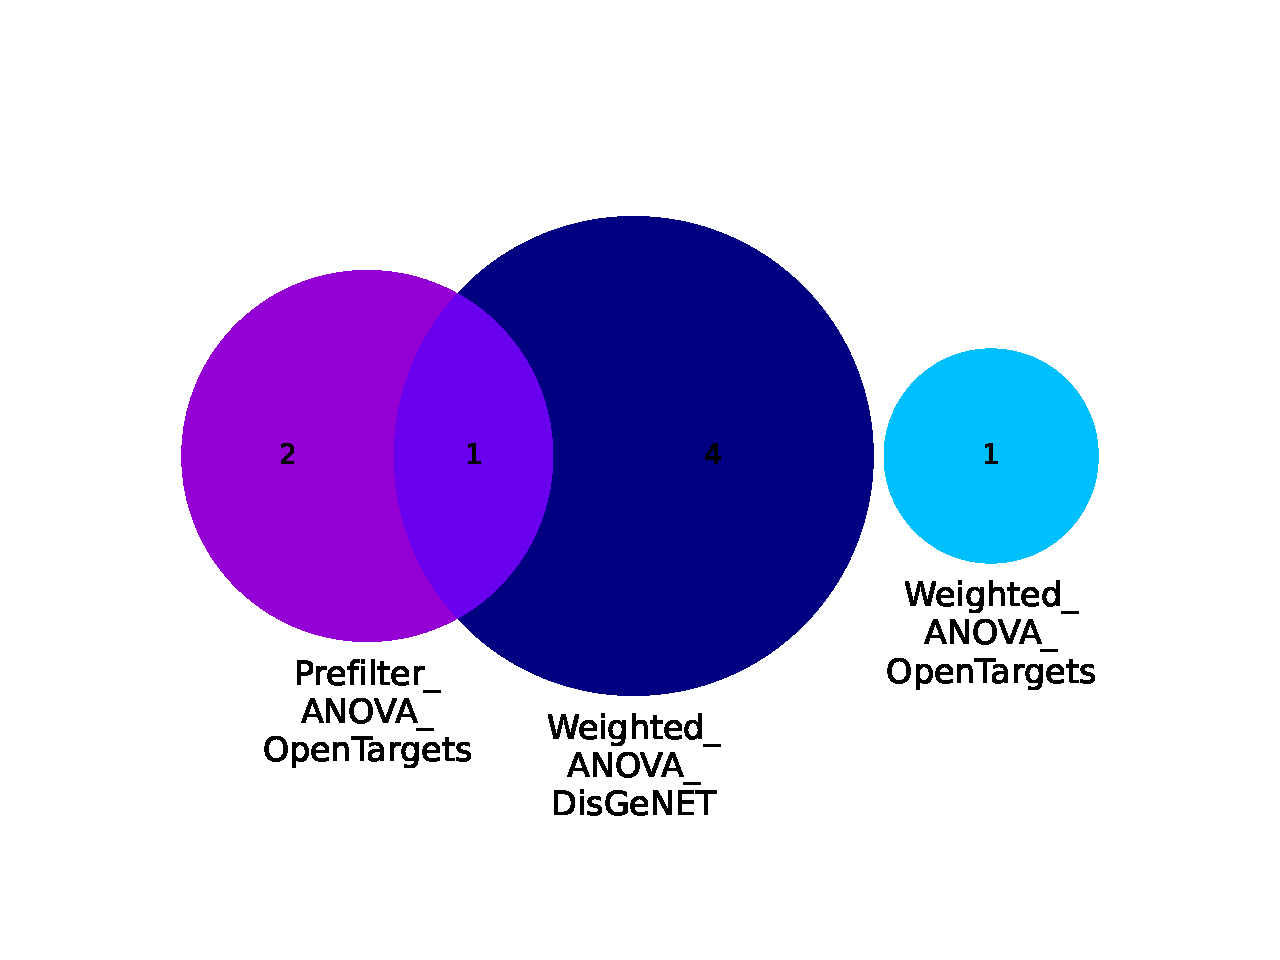
Ranking Overlaps
- file name: metrics/geneSignatureOverlaps.pdf
- <= 3 feature rankings: Venn diagram
- > 3 feature rankings: Upset plot
- shows overlaps of the top k feature sets for all feature selection approaches
- hint: NetworkActivity and CorgsNetworkActivity will not have any overlap with other approaches, as they have pathways as features and not genes as the others
Feature set overlaps for the top 20 features selected by the approaches used in the BRCA use case.
Feature Annotations and Enrichments
Comprior uses Enrichr to a) annotate the top k features and b) enrich these feature sets with terms. You can select the library to be used for that by providing its corresponding name as stated by Enrichr (see here) in the geneSetLibrary parameter (Enrichr section) in your config file. The plots and their source files are located at Comprior/data/results/YourExperimentName/evaluation/rankings/.
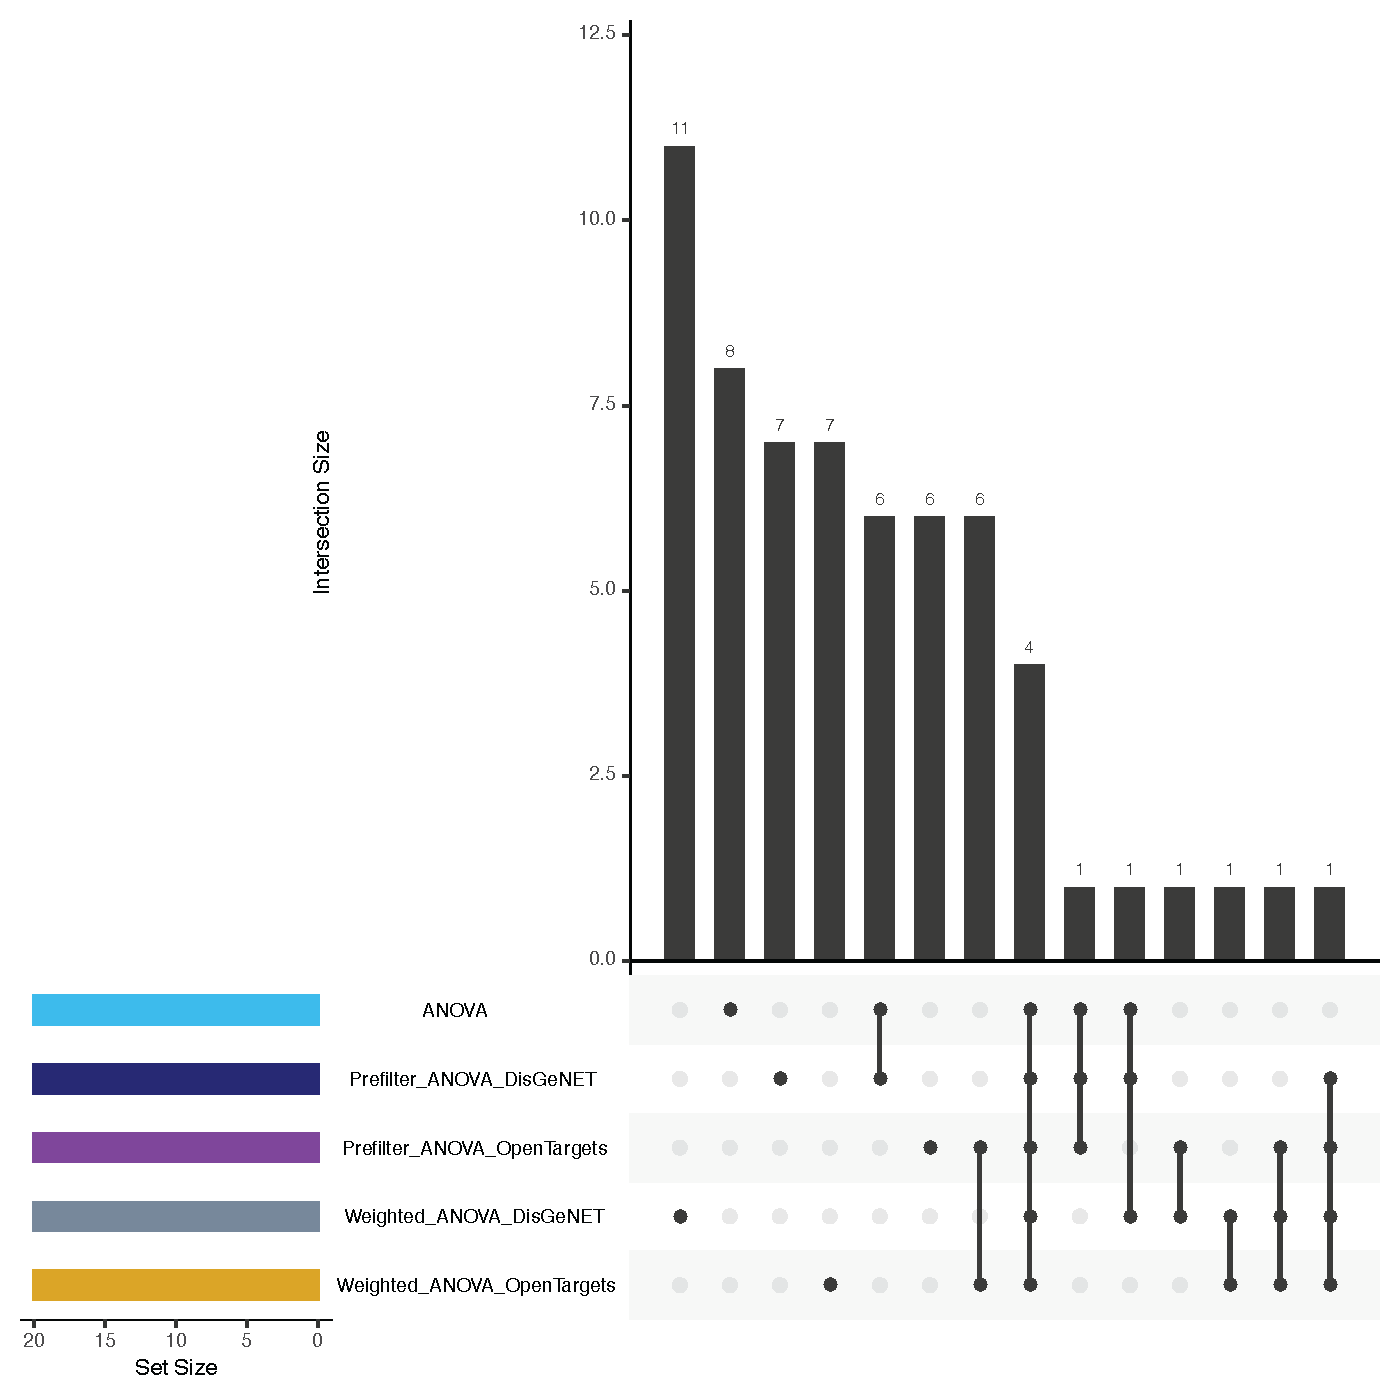
Annotation Overlaps
- file name: annotation/overlaps_annotatedGenes.pdf (based on source files with annotations: topk_ApproachName_annotatedGenes.csv)
- <= 3 approaches used: Venn diagram, > 3 approaches used: Upset plot
- shows overlaps of annotated terms for the top k annotated terms per feature set (=how many annotations feature sets share)
- for example, two feature sets might not actually have an overlap in their features, but some features might be annotated with the same terms
Overlaps of top 20 annotations made to the feature sets (top 20) selected by the approaches used in the BRCA use case.
Enrichment Overlaps
- file name: annotation/overlaps_enrichedTerms.pdf (based on source files with annotations: topk_ApproachName_enrichedTerms.csv)
- <= 3 approaches used: Venn diagram, > 3 approaches used: Upset plot
- shows overlaps of the top k enriched terms per feature set (=how much the enriched terms identified for the feature sets overlap)
- for example, two feature sets might not actually have an overlap in their features, but in both feature sets the same terms are enriched
Overlaps of top 20 enrichments for feature sets (top 20) selected by the approaches used in the BRCA use case.
Classification Performance
Comprior uses the top k features from every approach and classifies the original data set (and, if provided, the second labeled data set) with these features according to the parameters (which classifiers to use, k-fold cross-validation, which metrics to apply, etc.) specified in the config file. For every metric selected, Comprior creates line plots that show the average classification metric, e.g. accuracy, for all feature selection approaches. The plots and their source files for metrics (of type ApproachName_MetricName.csv) on the original data set are located at Comprior/data/results/YourExperimentName/evaluation/classification/metrics. The plots and their source files for metrics (of type ApproachName_MetricName.csv) on the cross-validation data set are located at Comprior/data/results/YourExperimentName/evaluation/classification/crossEvaluation/classification. The colors assigned to the approaches are consistent across all plots generated by Comprior.
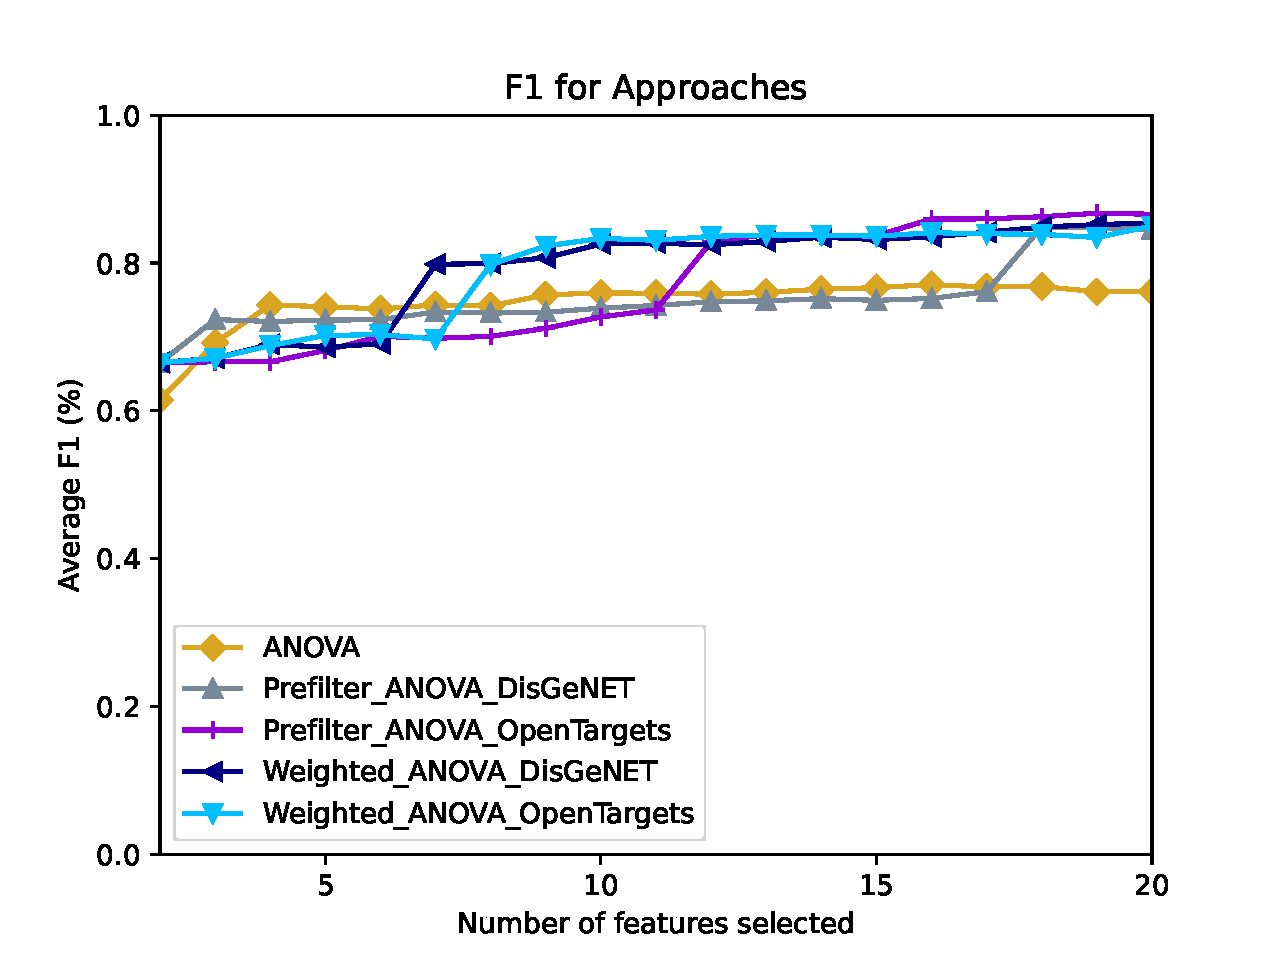
Average F1 score for increasing feature set sizes selected by the approaches used in the GBM-LGG use case (original TCGA data set was classified).
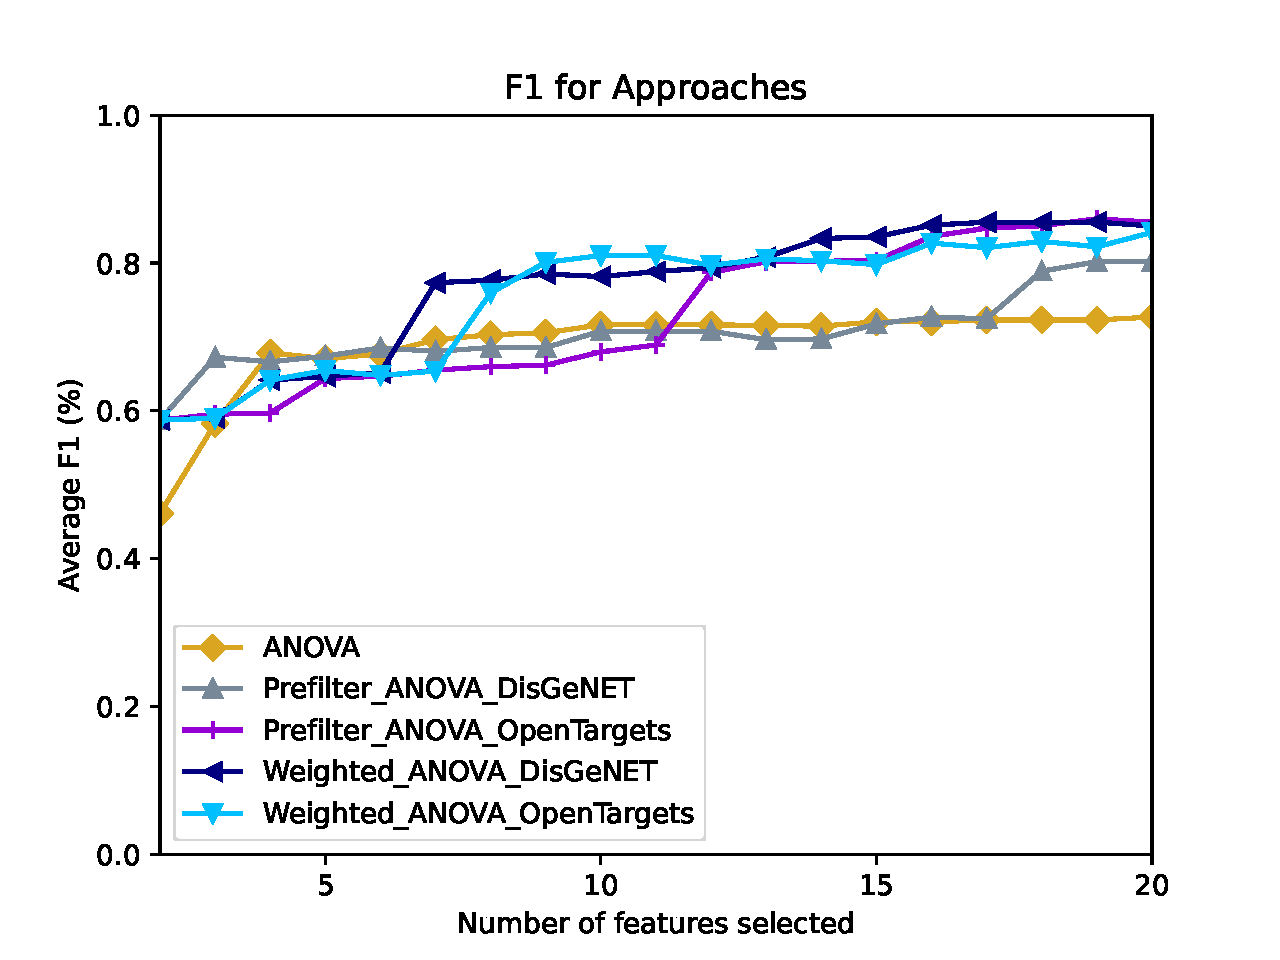
Average F1 score for increasing feature set sizes selected by the approaches used in the BRCA use case (labeled SCANB data set was classified, features were originally selected on the TCGA data set).
Feature Selection Runtimes
Comprior also logs runtimes of feature selection approaches (though no plots are created currently). Runtime statistics are located at Comprior/data/results/YourExperimentName/timeLogs, with one file per feature selection approach. The last line of each file always contains the overall runtime for feature selection. The remaining lines trace runtimes of single parts of the feature selection process, e.g. of prior knowledge retrieval or a traditional feature selection strategy.